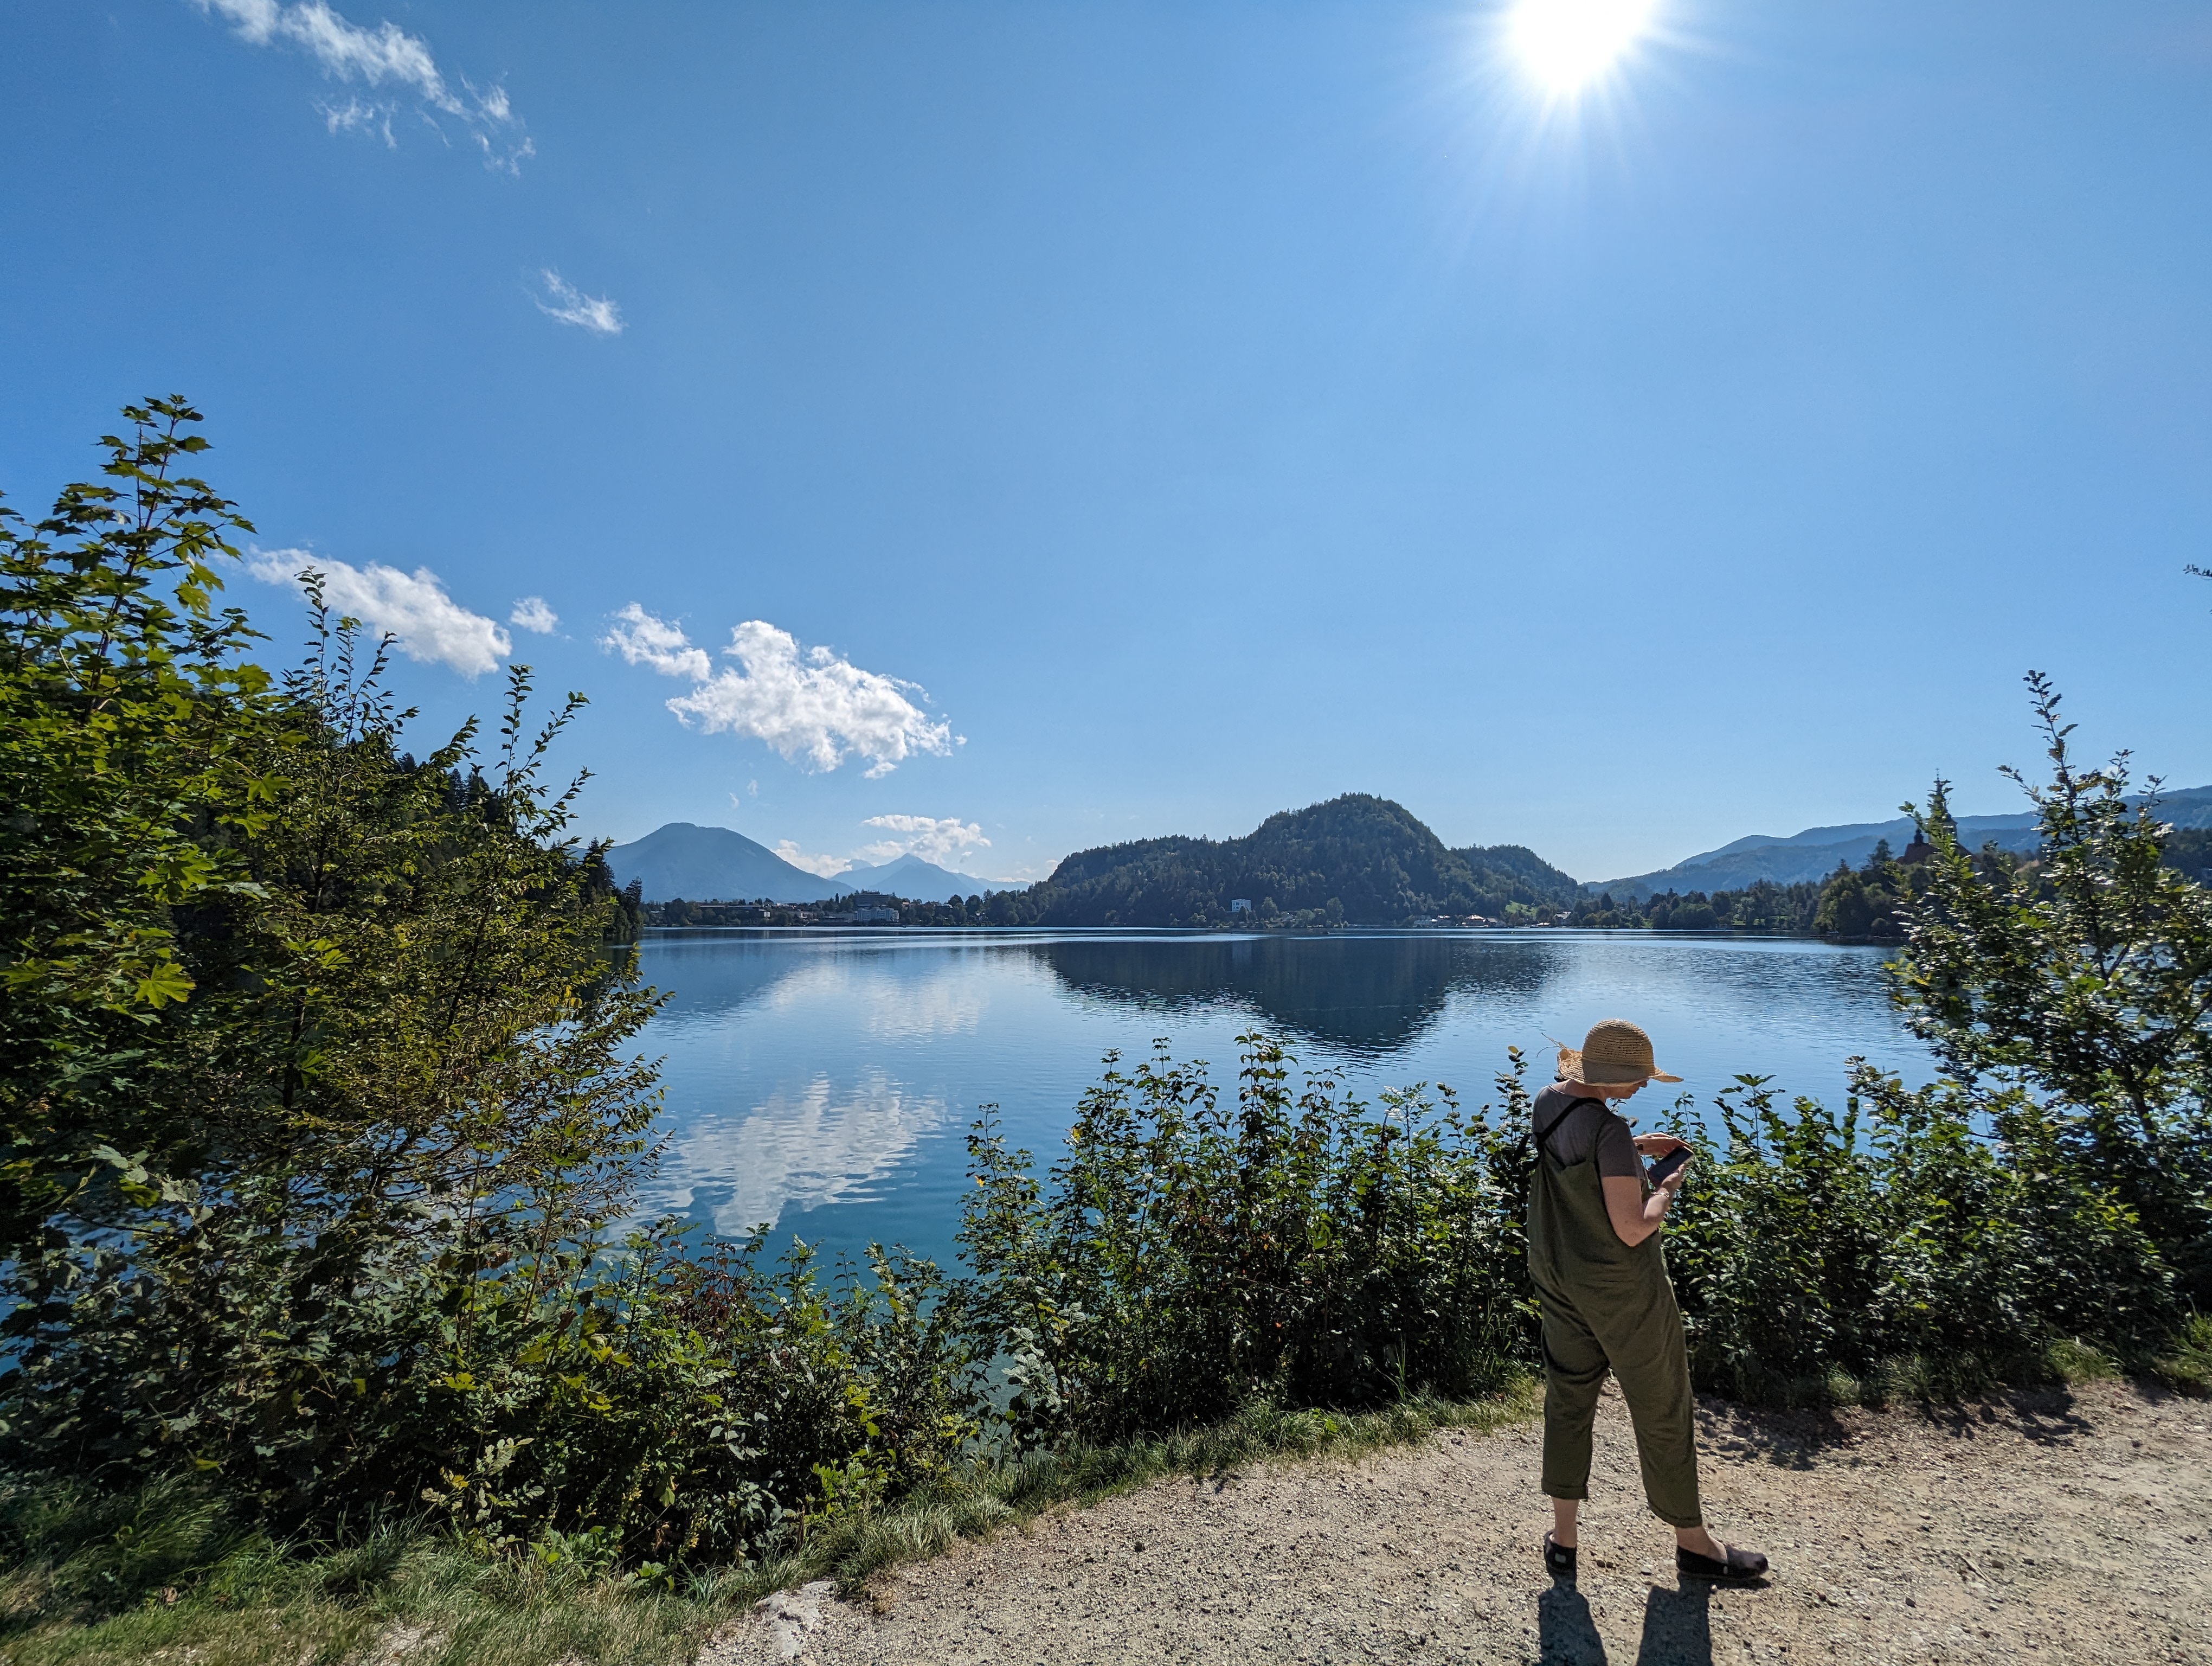
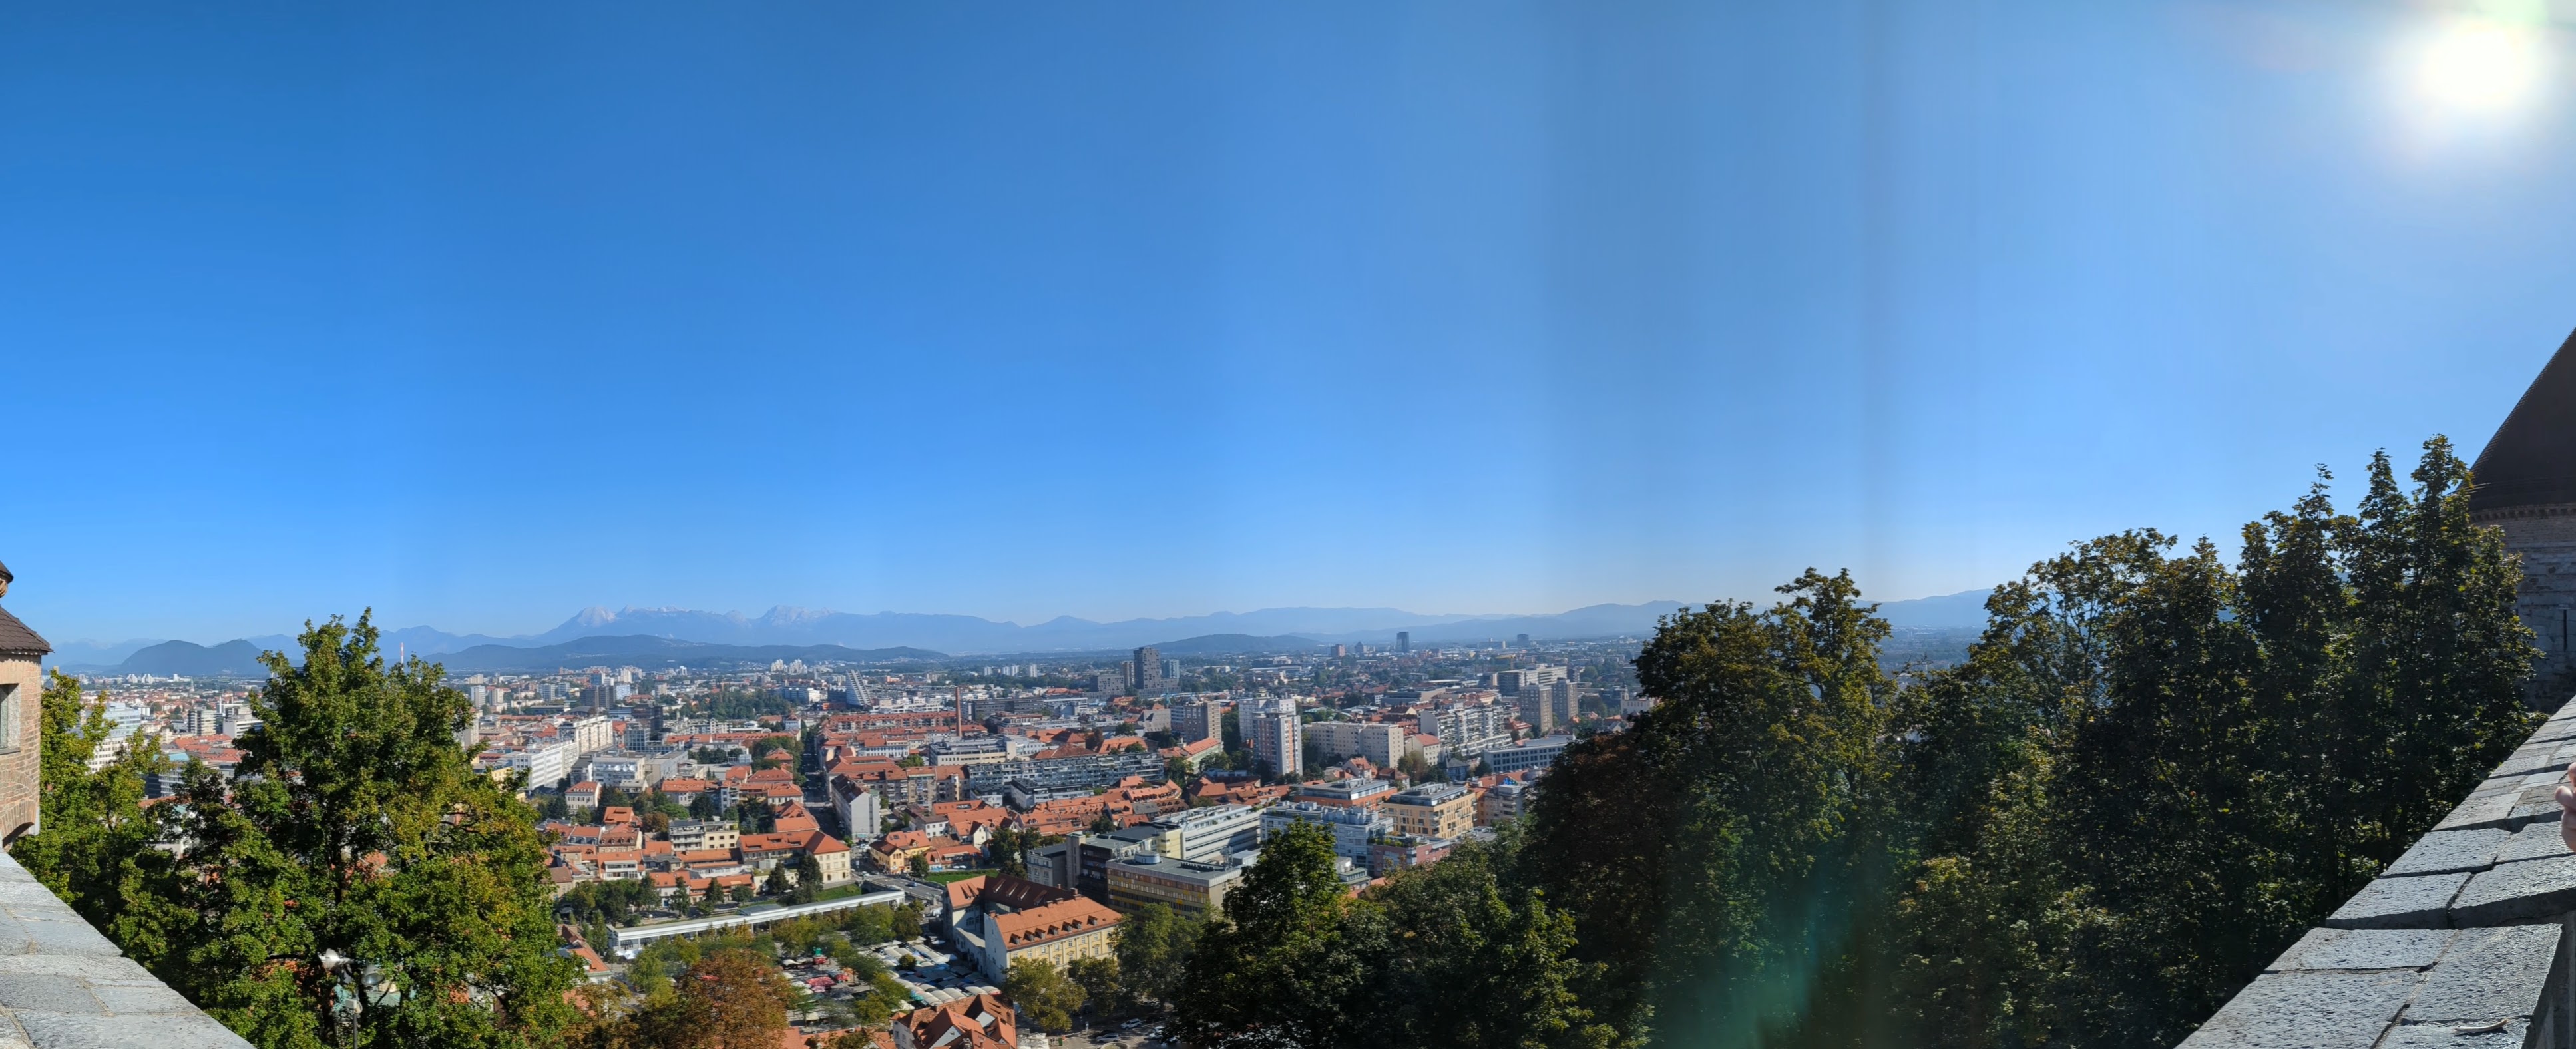
Slovenia, and its capital, Ljubljana, are beautiful. Just stunning. I just want to get that out of the way straight off! Just look at this panorama of Lake Bled to give you some idea.
I travelled there because I was invited to lecture on communicating hydrology as part of the HydRoData summer school at the University of Ljubljana. The summer school was jointly organised by the university and the UNESCO Chair on Water-related Disaster Risk Reduction.
Students on the course learnt valuable skills on collecting, managing, and processing hydrological data, including fieldwork and coding using R. My lecture fell in the middle of the week-long programme, on September 6th.
The run-in to the lecture was not ideal. I lost most of August to an awful bout of Covid (definitely not a cold!). I don’t fly so was travelling by rail and, whilst travelling out, our return leg via Milan got cancelled due a landslide blocking all routes between Italy and France. We had to quickly book a new route via Munich*.
However, I put a lot of work into my lecture and I am proud of the content I shared with the students. Titled “Hydrology. Sci-comm. Games”, I took the students through the importance of being able to effectively communicate hydrology. I drew on my backgrounds in both research and operational hydrology to discuss specific issues around that research-practice nexus.
Me presenting at the HydRoData summer school. Picture by Nasrin Attal.
I shared some tips on constructing effective storytelling and how they can use their own passions to help engage people with their research and projects. I structured the lecture around the six key attributes, or qualities, I believe society needs from hydrologists**. These are:
Knowledgeable
Technical
Practical
Playful
Sharing
Collaborative
You will be hearing a lot more from regarding these six qualities as I plan to create a set of resources around them. I’m sure they’ll feature on my Floodology channel in the near-future too.
If you’d like me to share this lecture with your students or group, please do get in touch. In the meantime, here is some my awful photography that does not do Slovenia justice.
Chris
*This too was disrupted when a broken powerline closed all of Munich station. We ended up waiting nearly 6 hours for a FlixBus in a bleak car park outside Salzburg…
This post represents my own views and is not intended to represent the views of my employer, present or past.
I’ve been umm-ing and ah-ing for a couple of months now about whether to write this blog, but I think I have finally had enough. You see, in Hull, we are at risk of flooding from the sea, or more specifically, the Humber Estuary. This risk emerges when low pressure out in the North Sea, caused by the storms, which can be common in the winter, effectively suck up the sea causing it to raise a little. High winds whip up waves, and these add a little more height to the water. All of this has the potential to raise the level of the sea, for a few hours, by up to a couple of metres. On December 5th 2013, a storm surge (as these events are called) raised the water level in the Humber by 1.7 metres.
The added complexity to this are the tides. The difference in the water level between low and high tide at Hull, according to the Associated British Ports (ABP) is between 3.5 m for a neap tide, and 6.9 m for a spring tide – this staggers the level we have determined to be 0 m, or sea level. This means the risk of flooding is all a matter of timing. If, on December 5th 2013, the storm passed by a few hours earlier or later the surge would have aligned with the low tide, and the additional 1.7 m would have barely been noticed by anyone. However, it was timed with a high spring tide, resulting in record water levels in the Humber and caused flooding in Hull and around the Estuary.
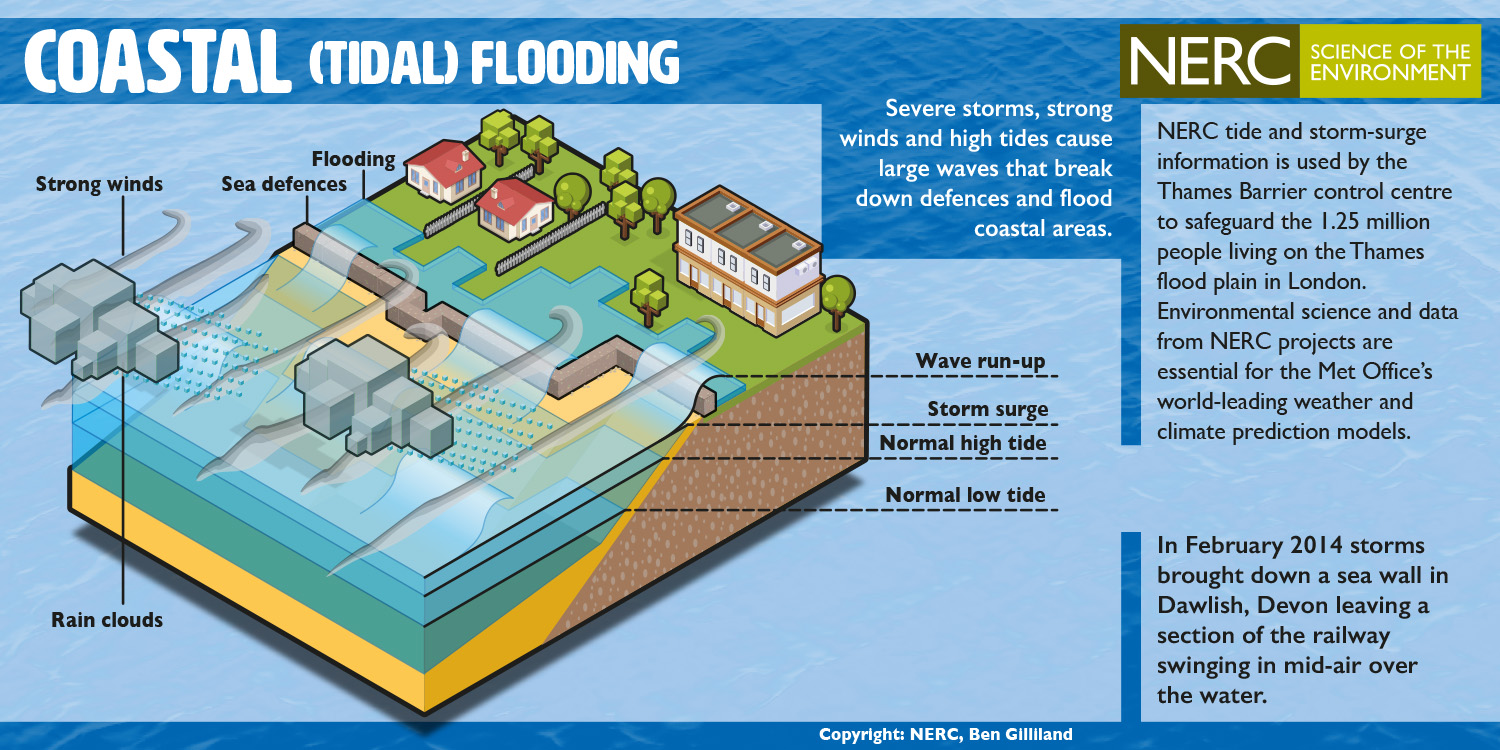
Graphic showing how coastal, or tidal, flooding forms. This was the type of flooding which occurred around the Humber in 2013. Thanks to NERC for producing these great resources.
When we design and build flood defences on the coast we don’t build them to just hold back tidal levels of the water, but also to defend against enhanced water levels produced by storm surges. Since 2013, the defences around Hull have been updated and a repeat of the event would result in little or no flooding in the city – I don’t know the exact level of the defence, but we can say that it is able to contain sea levels of at least 1.7 m higher than the highest natural tidal level.
A big issue facing Hull is sea level rise. Sea level has been rising since the end of last ice age, and is set to continue in the future. On top of this, the climate change caused by our industry is accelerating this. Our best estimates for the Humber area, assuming that as a species we continue increasing our influence on the climate, suggest the sea level will be around 1 m higher in 100 years than they are today – this will increase the risk of flooding and we need to ensure that the public understand this and that we continue to invest in improving the standards of our defences to keep pace.
On the first point, talking to residents of Hull about the risk of flooding from the Estuary provokes two responses. (1) There is a lack of appreciation of the risk from the Estuary, and when I start to talk about the 2013 flooding, people tend to share with me their experiences of the 2007 flooding (a surface flooding event). (2) People tend to feel that there is no point in doing anything as “Hull will be underwater in 100 years”. This latter point is what I want to discuss here, it’s a common perception and leads to a kind of apathy where people become disengaged with flood risk and actions to mitigate for it, but it is wrong.
It is a deeply held belief that goes beyond even the city – in 2015, Dr Hugh Ellis, the now Head of the Town and Country Planning Association (TCPA), made the claim that the city would be underwater in 100 years –
“We need to think about moving populations and we need to make new communities. We need to be thinking, does Hull have a future?” (Source – Daily Telegraph)
Ok, he was trying to make a valid point, one that sea level rise is going to increase the risk of flooding for coastal cities, but I don’t think bold, and inaccurate statements, like this are helpful, and they only result in residents of the areas becoming disengaged – why do anything about the problem if it is futile?
But where does this idea come from? Why are people convinced Hull will be underwater in 100 years? Why do people think it will become the “Venice of the North”? Well, look at the map below –
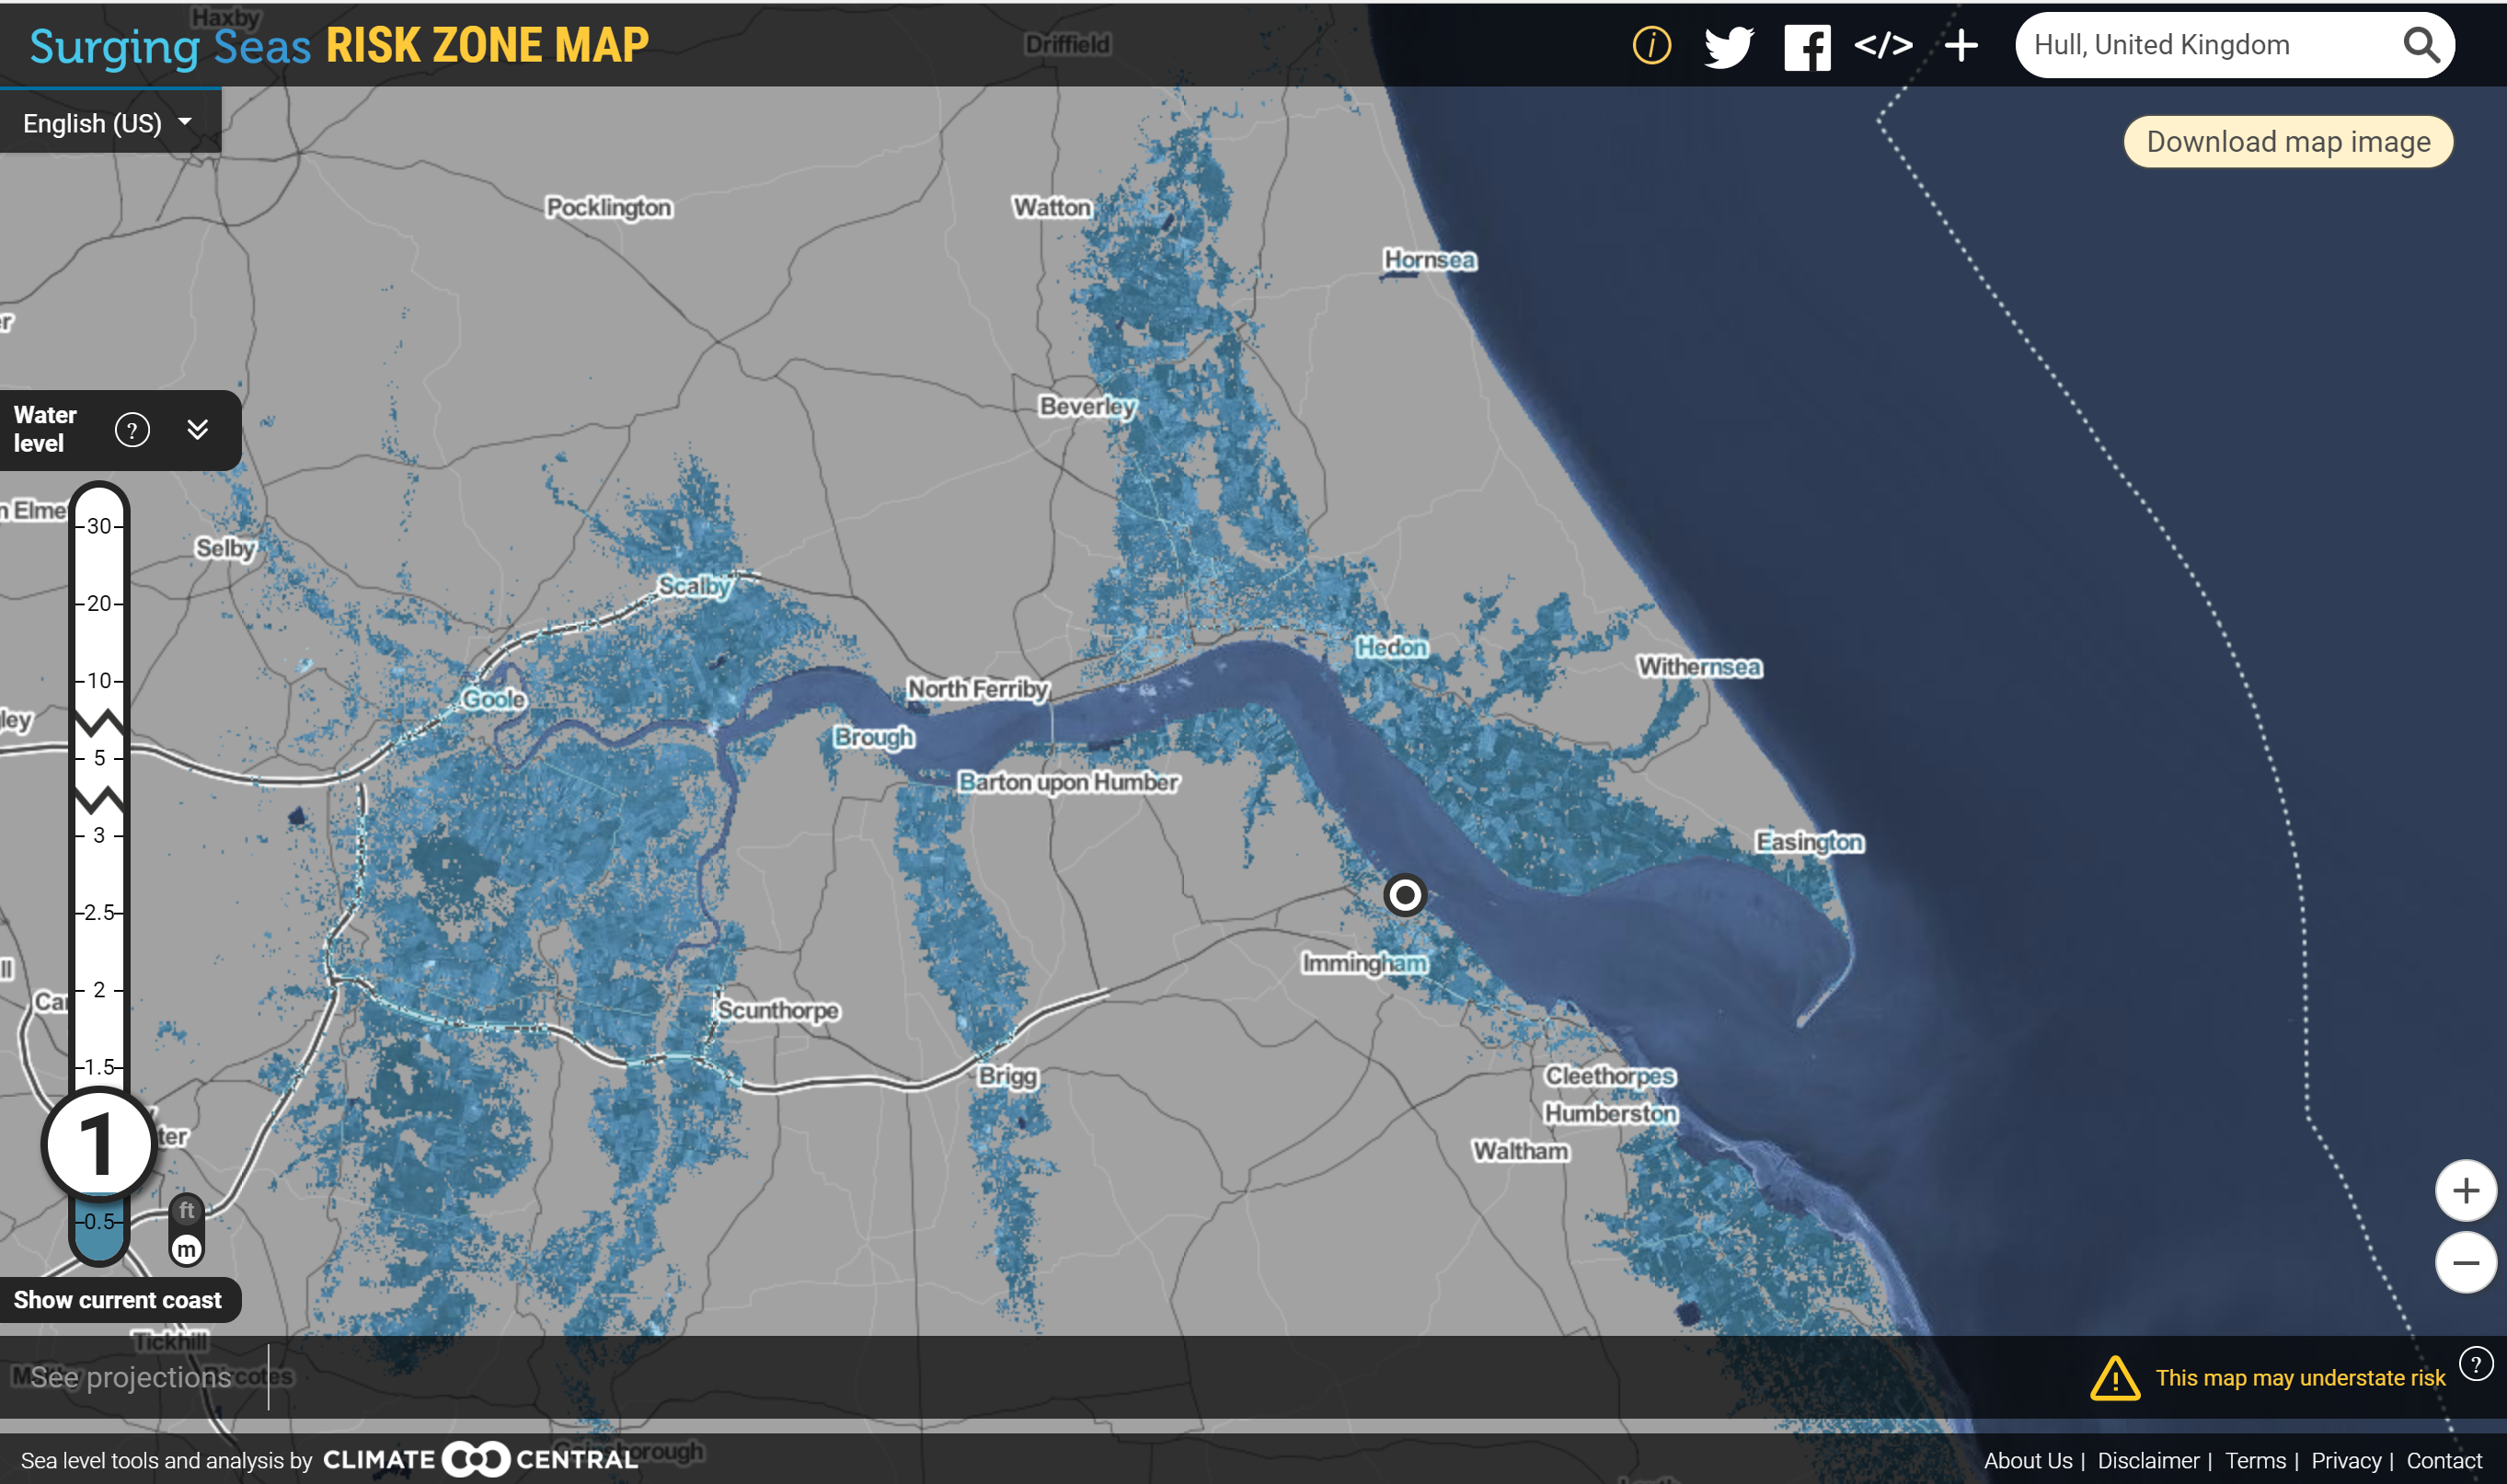
Screenshot from Climate Central’s Surging Seas Risk Zone Map – this shows the Humber Region, UK, with a 1 m sea level applied.
This is map of ‘risk’ taken for the Humber area. For areas outside of the US, the Risk Map has been produced using a map of land heights obtained from space by the Shuttle Radar Topography Mission, which mapped the entire globe at resolutions between 30 m and 90 m. The areas shaded in blue are all those ‘below sea level’ – normally 0 m, but in the map above I’ve set it at 1 m to represent the predicted sea level in 100 years time. Hull isn’t labelled on that map, but it basically the large blue area between North Ferriby and Hedon – very clearly ‘under water’.
But the method is problematic, it’s too simple. An average measurement of land heights over a 30 m area is fantastic when considering it is for the whole planet, however for determining flood risk it’s a bit rubbish. It smooths the land surface, removing obstacles, like wall, roads and buildings, and crucially, flood defences. The method also ignores ‘hydraulic connectivity’*, basically meaning that for water to flood an area it has to have a source of water and a route for it to get there – flood defences work by removing this hydraulic connectivity and this is why today the Humber region, and much of Holland, is close to or below sea level, but not under the sea.
To understand the actually risk posed by sea level rise requires a more complex model, one which accounts for tides, contains more detailed data, and more importantly includes flood defences. Our model (paper here behind paywall) does this, and a version of it is incorporated into Humber in a Box – with both of these we observe no flooding around the Estuary for natural tides with a 1 m sea level rise. This is because the defences are built to hold back the much higher water levels caused by storm surges.
Climate Central have been careful to refer to this shading as ‘risk’, and not direct inundation by the sea, but the use of blue and not making this explicit anywhere opens this up to mis-interpretation where ‘below sea level’ means ‘below the sea’. This is clearly happening – see this article in the Conversation, which made the BBC Sports pages, which used the app to suggest Everton’s new stadium “could end up underwater” in the future, or this article shared by the awesome Geomorphology Rules Facebook page, suggesting that coastal cities in the US will be “drowning in water”.
Sea level rise is going to increase the risk of flooding in coastal cities but they are not going to be under water. The risk does not emerge from the tidal water levels, which will most likely be contained by present defences, or those to be built in the future. However, the risk from storm surges will increase – the likelihood of events like December 5th 2013 is set it increase, both in strength and frequency, and with 1 m extra sea level in 100 years our defences will need to be updated to cope with the enhanced levels. This will take a lot of money, a lot of effort, a lot of political will, and this requires the buy in and support of the residents of these areas. Telling them, or suggesting, that they will be required to relocate will only achieve the opposite.
Sea level rise and the related flood risk is a complex issue and we can’t keep trying to find simple answers.
*For areas within the US, the method uses much higher resolution height data, and accounts for hydraulic connectivity by shading areas differently.