I’ve been in my new job for two months now and I am pleased to report that I am still loving every second of it. Working with students is full of highs and lows – the last few weeks has had its share of both – but is incredibly rewarding. Although I’ve had plenty of experience lecturing and leading workshops, I’ve not had much experience of the one-to-one tutorial work and I’ve been enjoying getting to grips with this part of the job.
Teaching
I am especially enjoying getting to use creative and game-based approaches for my Environmental Hazards module. This includes some of my favourite tools and also things I have worked on in the past but never really had the opportunity to use properly. Firstly, I wanted the students to appreciate how individuals had different vulnerabilities and resilience to hazards – we explored this in the context of children and young people using the Help Callum and Help Sali 360 immersive storytelling videos from the Flood Stories project. Five years on from finishing these, this was the first time I had got to use them!
Stop Disasters is absolute classic of the games for geoscience and disaster risk reduction genres. It is made for school kids really, but framed in the right way it can be useful in higher education too. I’ve already used the flood level in my River Management module to explore the ‘art of the possible’ in flood risk management, and a couple of weeks ago I used the tropical storm level in my Environmental Hazards module to allow students to try out counterfactual thinking. We also played Good Morning, a micro-RPG I wrote last year to explore how downward counterfactuals work. I was pleasantly surprised at how well it worked and a good feeling to effectively use a tool I had written.
Goodbyes
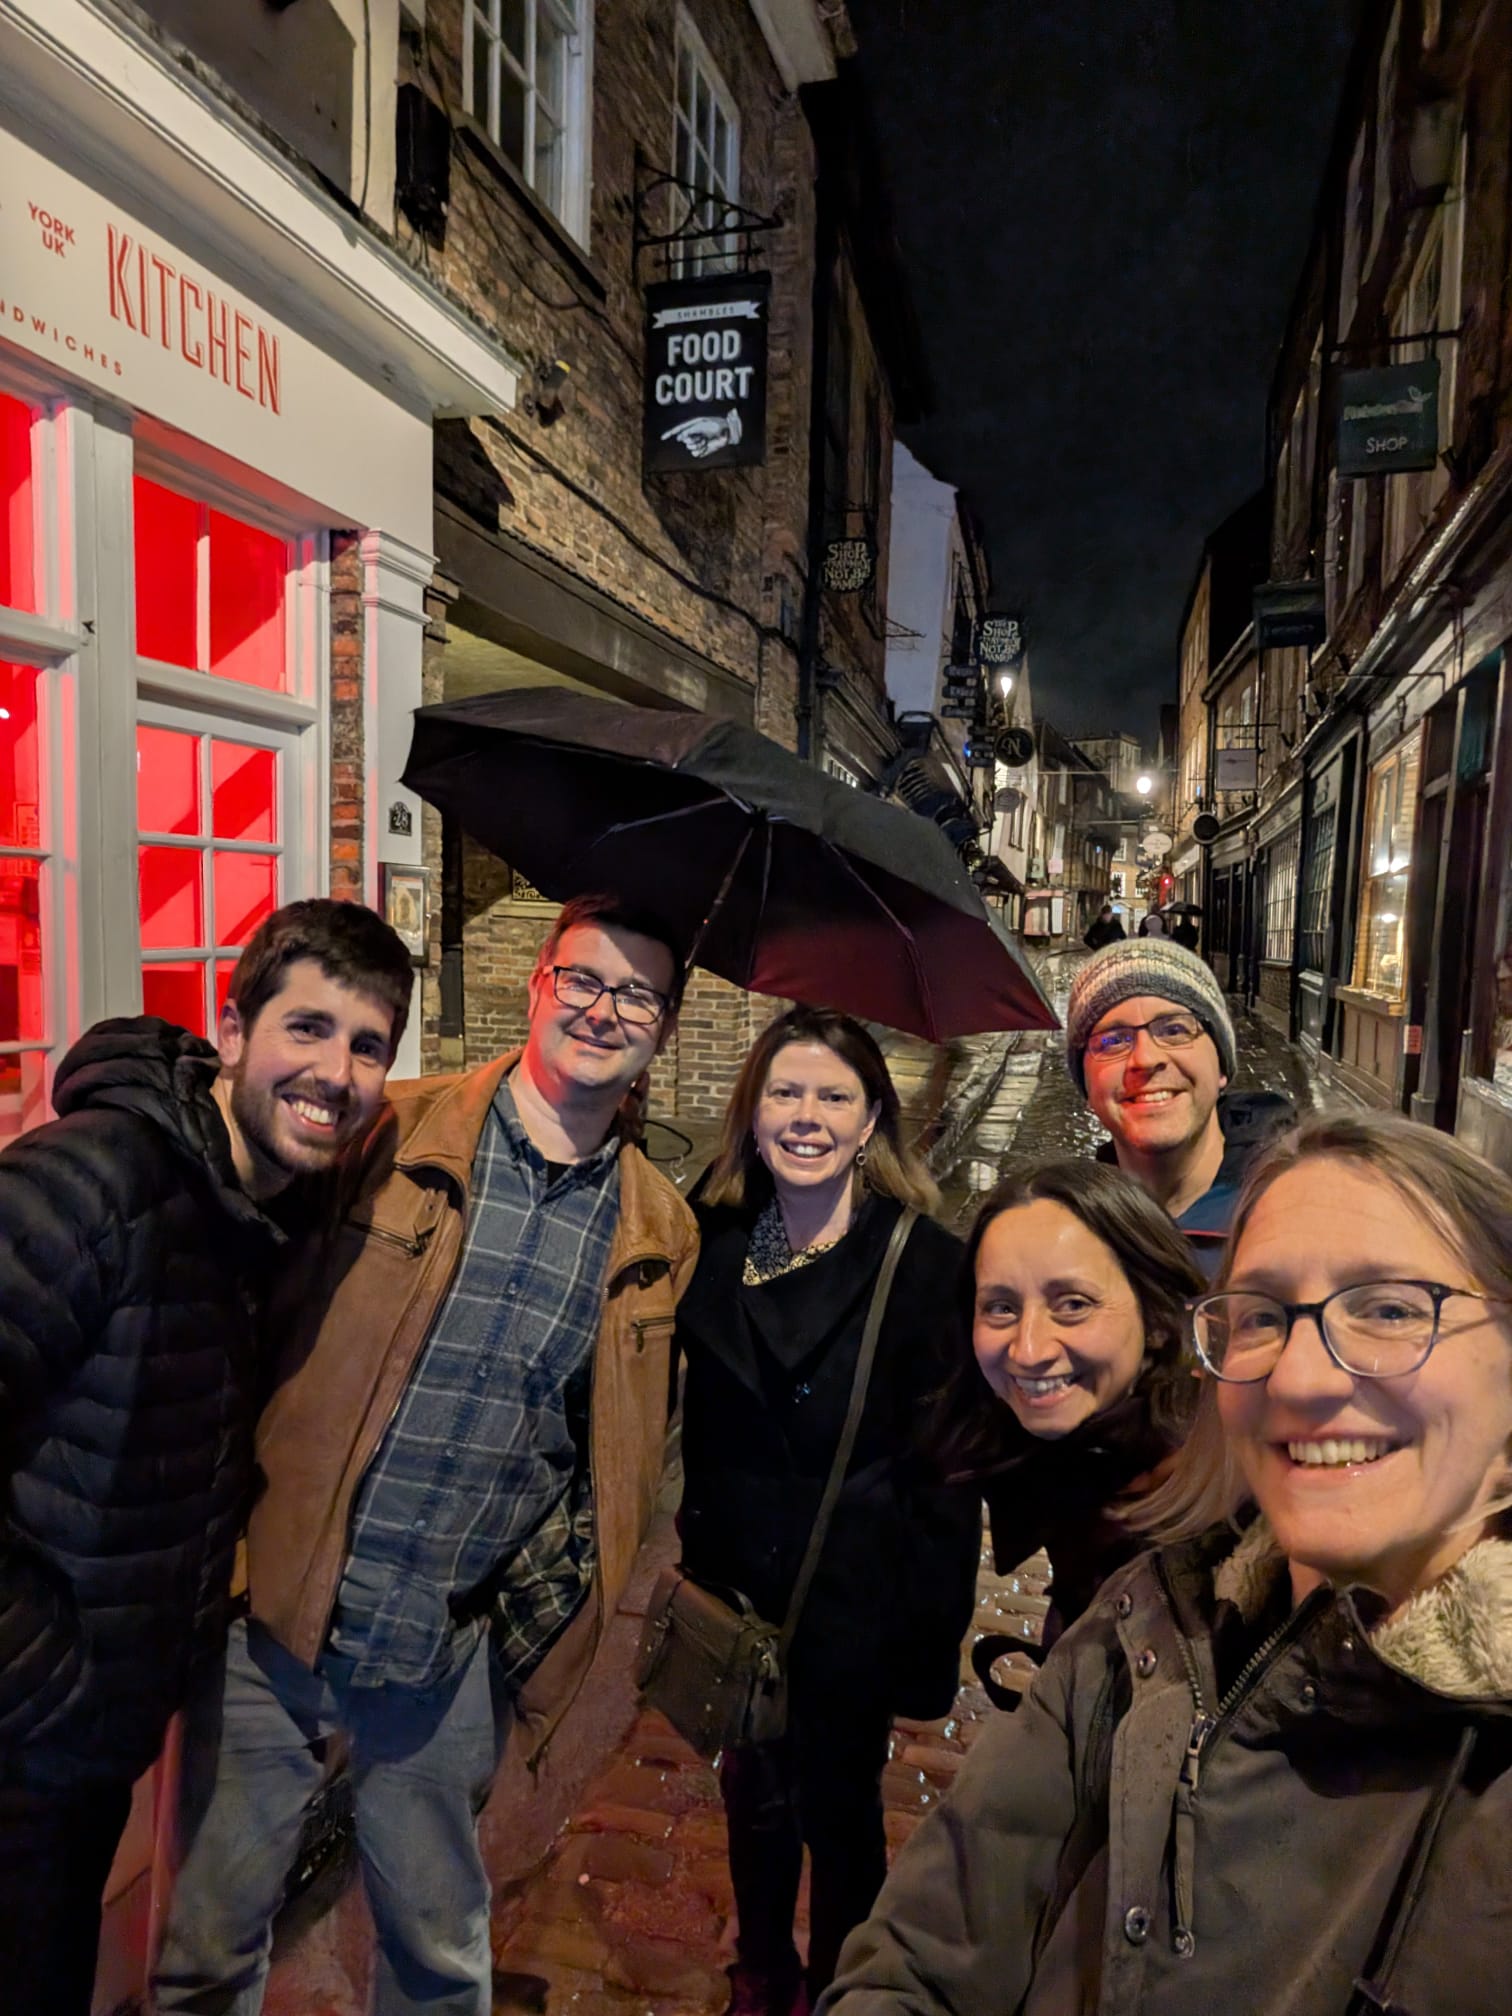
This month I also got to say a proper goodbye to my former Environment Agency colleagues from the Flood Hydrology Improvements Programme (FHIP). As a dispersed national team, we worked almost entirely remotely and only got together in-person two or three times a year. They chose to meet in York for their first meeting of 2026 so I could join them for dinner. This was such a nice gesture and I was reminded of just how much I miss them all. It still does not feel right that I won’t get to see them all regularly anymore…
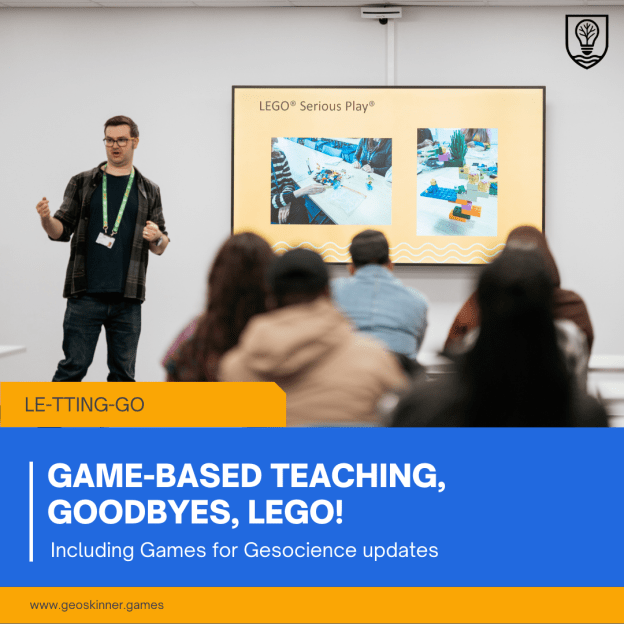
NERC EMBRACE with LEGO!
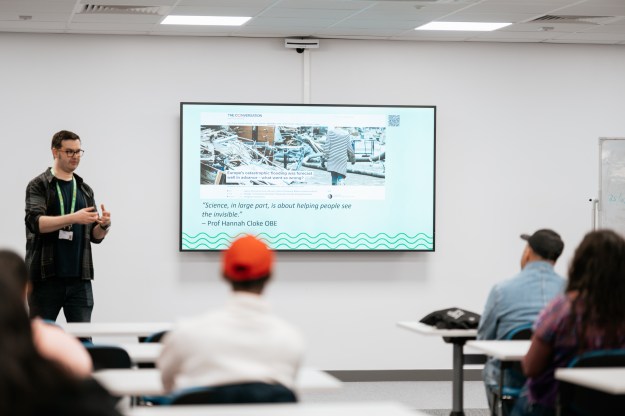
Another highlight from the last month was the workshops for the NERC EMBRACE Enviro project. Led by the wonderful Dr Olalekan Adekola, this pilot project is part of the NERC Opening up the Environment call, and seeks to engage members of the refugee and migrant communities with environmental science and careers. Over three days, two groups undertook two days of free training. This included analysing water quality in the lab, GIS, and science communication.
I was involved in the project in the middle of last year, long before my current role was even advertised. I was included as an external consultant – through my side quest as GeoSkinner – to support the science communication training. These workshops then were also my last act as a freelancer and were based on my LEGO(R) Serious Play(R) inspired Play your Research workshops. I helped the participants find and visualise their science and personal stories of the workshop by building with the LEGO bricks.
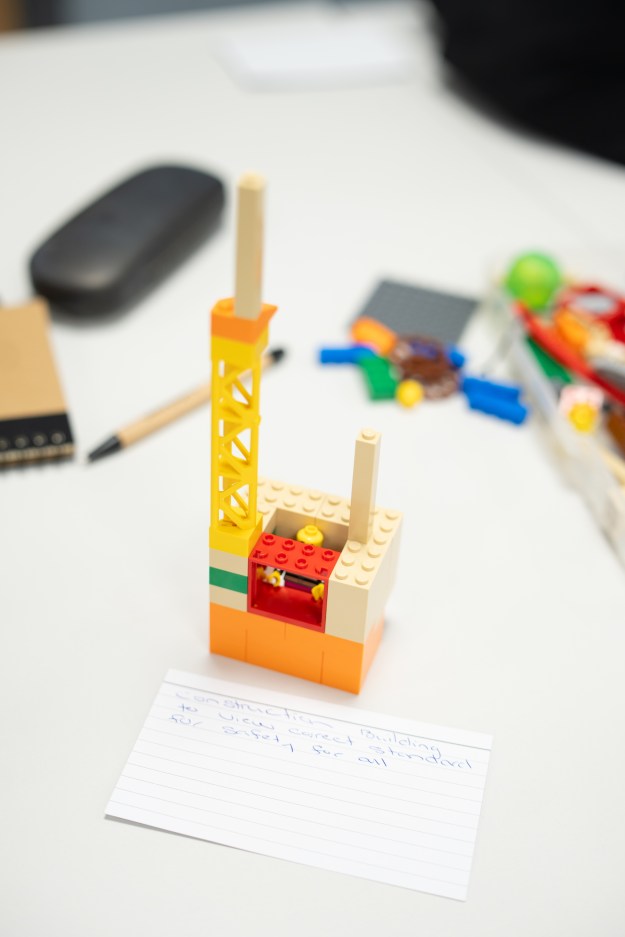
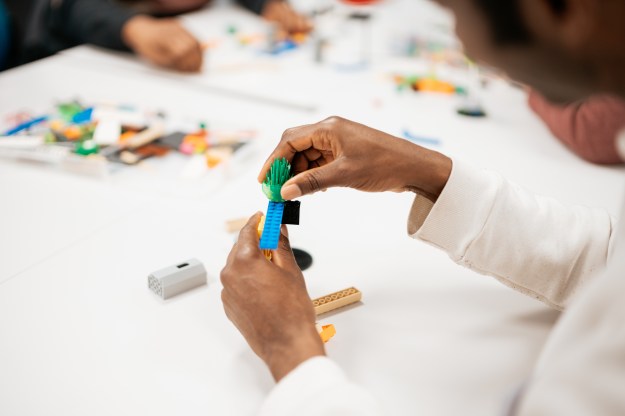
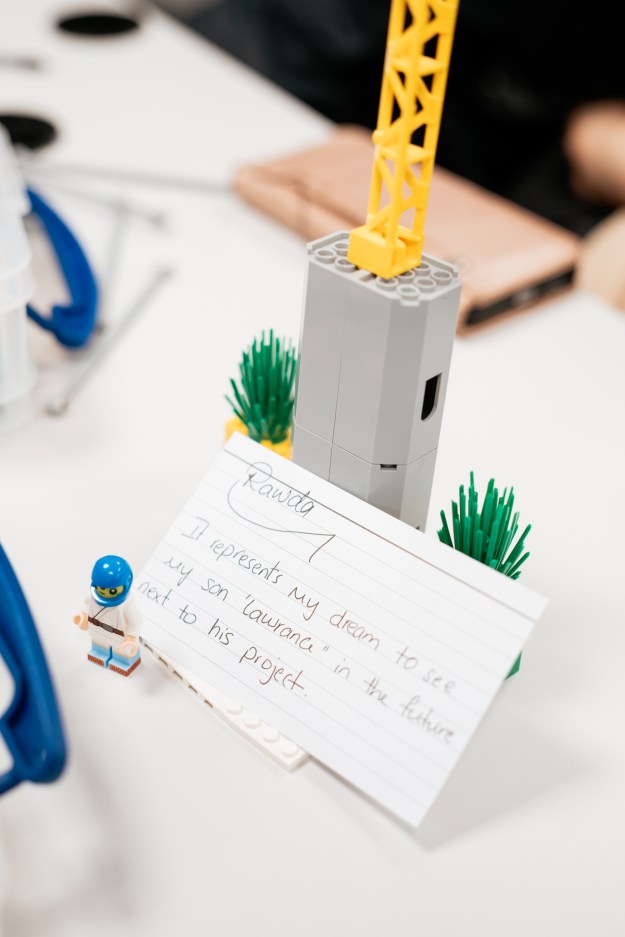
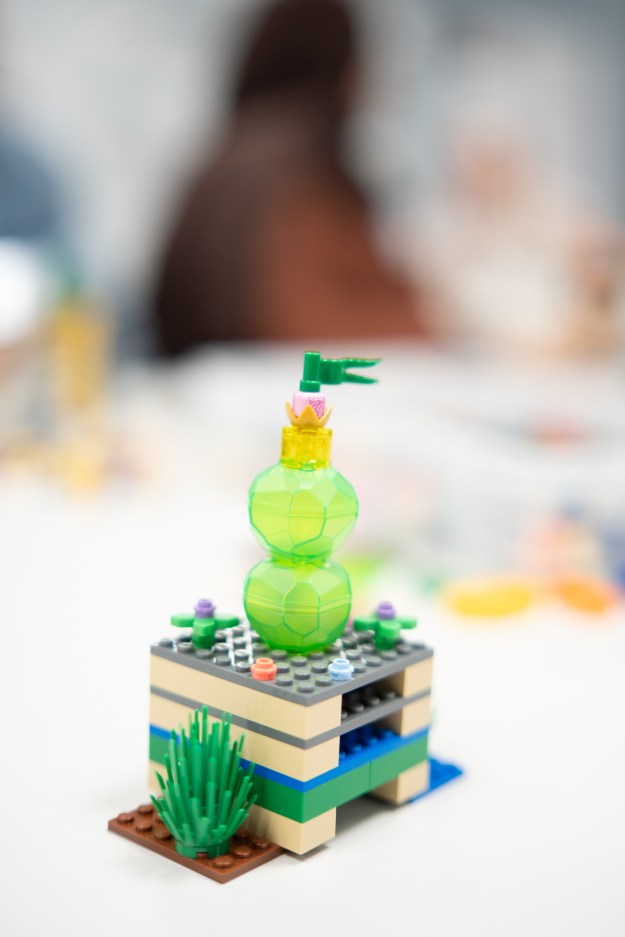
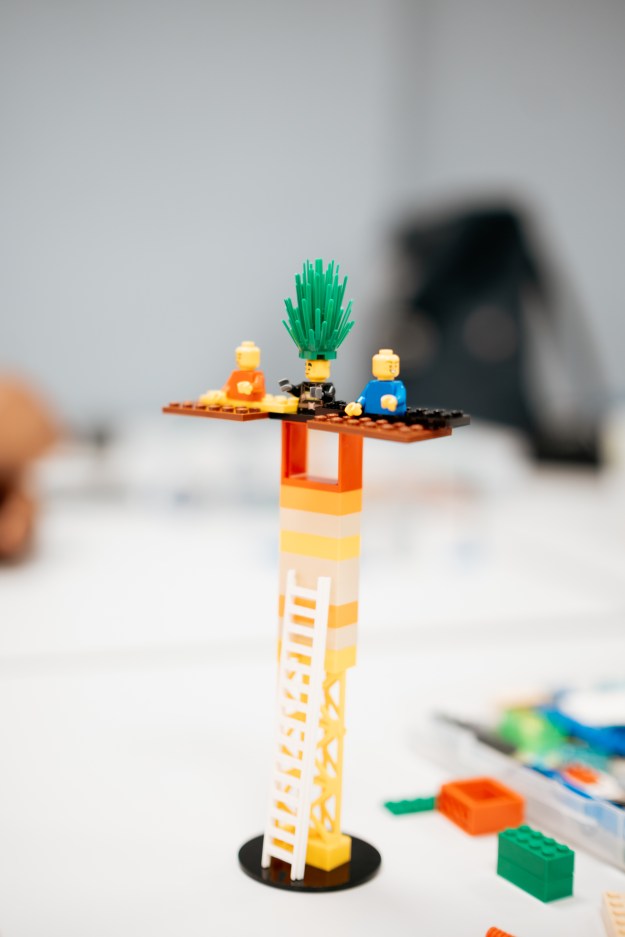
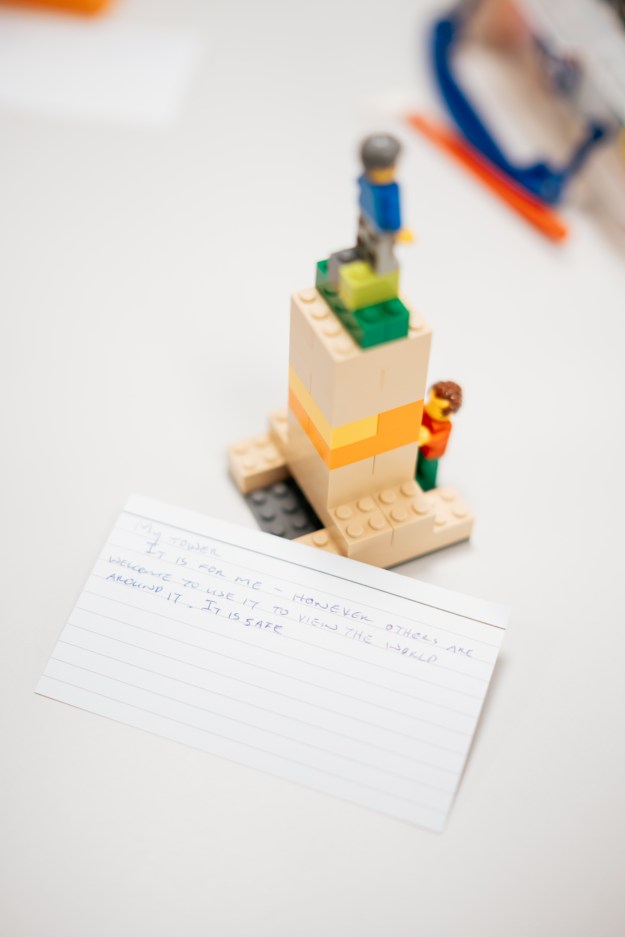
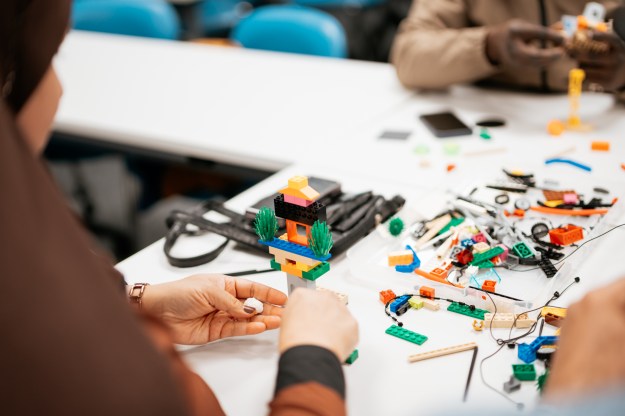
These workshops never cease to amaze me. The start is often a mix of some being excited at the prospect of playing with LEGO bricks and others being cynical for the same reason. But, once we get going people are surprised by their own imagination and creativity and the insights that they self-reveal are truly incredible. I reflected on the workshop that not only did the participants discover their own stories, their insights highlighted the power of the workshop and the benefits they got from it. It would have been powerful evaluation data.
New Paper
I have a new paper out! For the last few years I have been part of an International Association of Hydrological Sciences (IAHS) working group on science communication, part of the organisation’s HELPING science decade. The paper reflects the collective work of the group – expertly led by Christina Orieschnig and Soham Adla – and provides a summary of science communication in hydrology and tips to make sure it is effective.
Honestly, many have put a lot more working into this than I have but I’m proud to have contributed and to have my name attached. You can read the open access paper in Hydrological Sciences Journal.
Games for Geoscience
In the last few weeks the organising committee of the European Geoscience Union General Assembly has been working hard wrangling nearly 20,000 abstracts into a conference programme. With 14 abstracts, Games for Geoscience fell just below the threshold for a full science session (talks + posters) so instead this year the session will be PICOs.
I’m a little disappointed as the session usually has a good involvement with those attending virtually, and I have found the poster and PICO sessions far less accessible for virtual presenters and attendees than talks. But, I’m still looking forward to another awesome session and of course, the world famous Geoscience Games Night will be back too!
Next month’s newsletter will be devoted to EGU, including the full programme for the Games for Geoscience session and sharing the contributions I’ll be making at the conference – my first as a academic since before the Covid lockdowns!
See you in April!
Chris
Views expressed in this newsletter are mine and do not represent those of my employer. Content and links are provided for informational purposes and do not constitute endorsements. I am not responsible for the content of external sites, which may have changed since this newsletter was produced.
Get this newsletter sent directly to your inbox each month: