Tag Archives: modelling

Imagination Engines Logo

Imagination Engines – August 2025

Welcome to August’s issue of Imagination Engines! Thank you for reading.

This summer I have been given a wonderful opportunity to develop a brand new module on River Management for York St John University’s Geography courses. I am so excited for this and have been loving designing the module and beginning to put the elements together. It’s hard work – fun hard work – and consequently I’ve had to reprioritise how I use my spare time.

It does not change my long-term goal of writing a book. In fact, I think the whole process is excellent practice and brings that goal closer. However, I need to temporarily change how I use this newsletter – I have been using it as a motivator to get me writing regularly and to explore different ideas, with 3-4 articles each month. I just don’t have capacity for this now but want to maintain a monthly publication schedule. Instead, I will focus on giving short updates on my main projects that are listed on the front page of my website.


Ongoing Research

I have a new paper out this month as a co-author. The work was led by my former supervisee, Josh Wolstenholme, and covers his PhD field work on the geomorphic change induced by the installation of leaky woody dams. It is a timely reminder that rivers move and change, especially if you stick stuff in them.

Wolstenholme et al (2025). Localised geomorphic response to channel-spanning leaky wooden dams. Earth Surface Dynamics. DOI:10.5194/esurf-13-647-2025


Adventures in Model Land

This is an open-source system to make game worlds based on the numerical models we use to learn about the world around us and predict the future. It is inspired by the world building used in tabletop roleplay games (such as Dungeons & Dragons) and just needs your imagination. You find out more and download the free guide here.

I’ve also started a Discord server for Adventure in Model Land as a place to discuss the system, share the game worlds you create, and to get help from others. Join it here.


FloodSkinner YouTube Channel

I had a new Short out in the last month. I came across some videos discussing rumours and leaks about the (long) upcoming Grand Theft Auto 6, including some indications it might include a dynamic weather system. The rumours suggest that the weather system would interact with the terrain and influence the game – it rains, water pools, and roads flood and become inaccessible.

This is obviously very exciting for me so I put my thoughts into a Short. I was short on time and cutting all the clips together was quite laborious – unfortunately I didn’t get chance to do a full set up and did not light my greenscreen properly, so this is a bit messy (the kitten also moved the screen partway through filming and messed it up more…). Despite this, it did moderately well, with >1,100 views.


Games for Geoscience

After the annual General Assembly of the European Geoscience Union (EGU), summer is pretty quiet for Games for Geoscience. With the call for sessions for the 2026 General Assembly now out, in the coming month I’ll be pulling the team together and proposing what would be the 9th Games for Geoscience session.

I still have ambitions to make it more than just an EGU event, with year-round activity and a community. If you’re interested, you can join the Discord server.
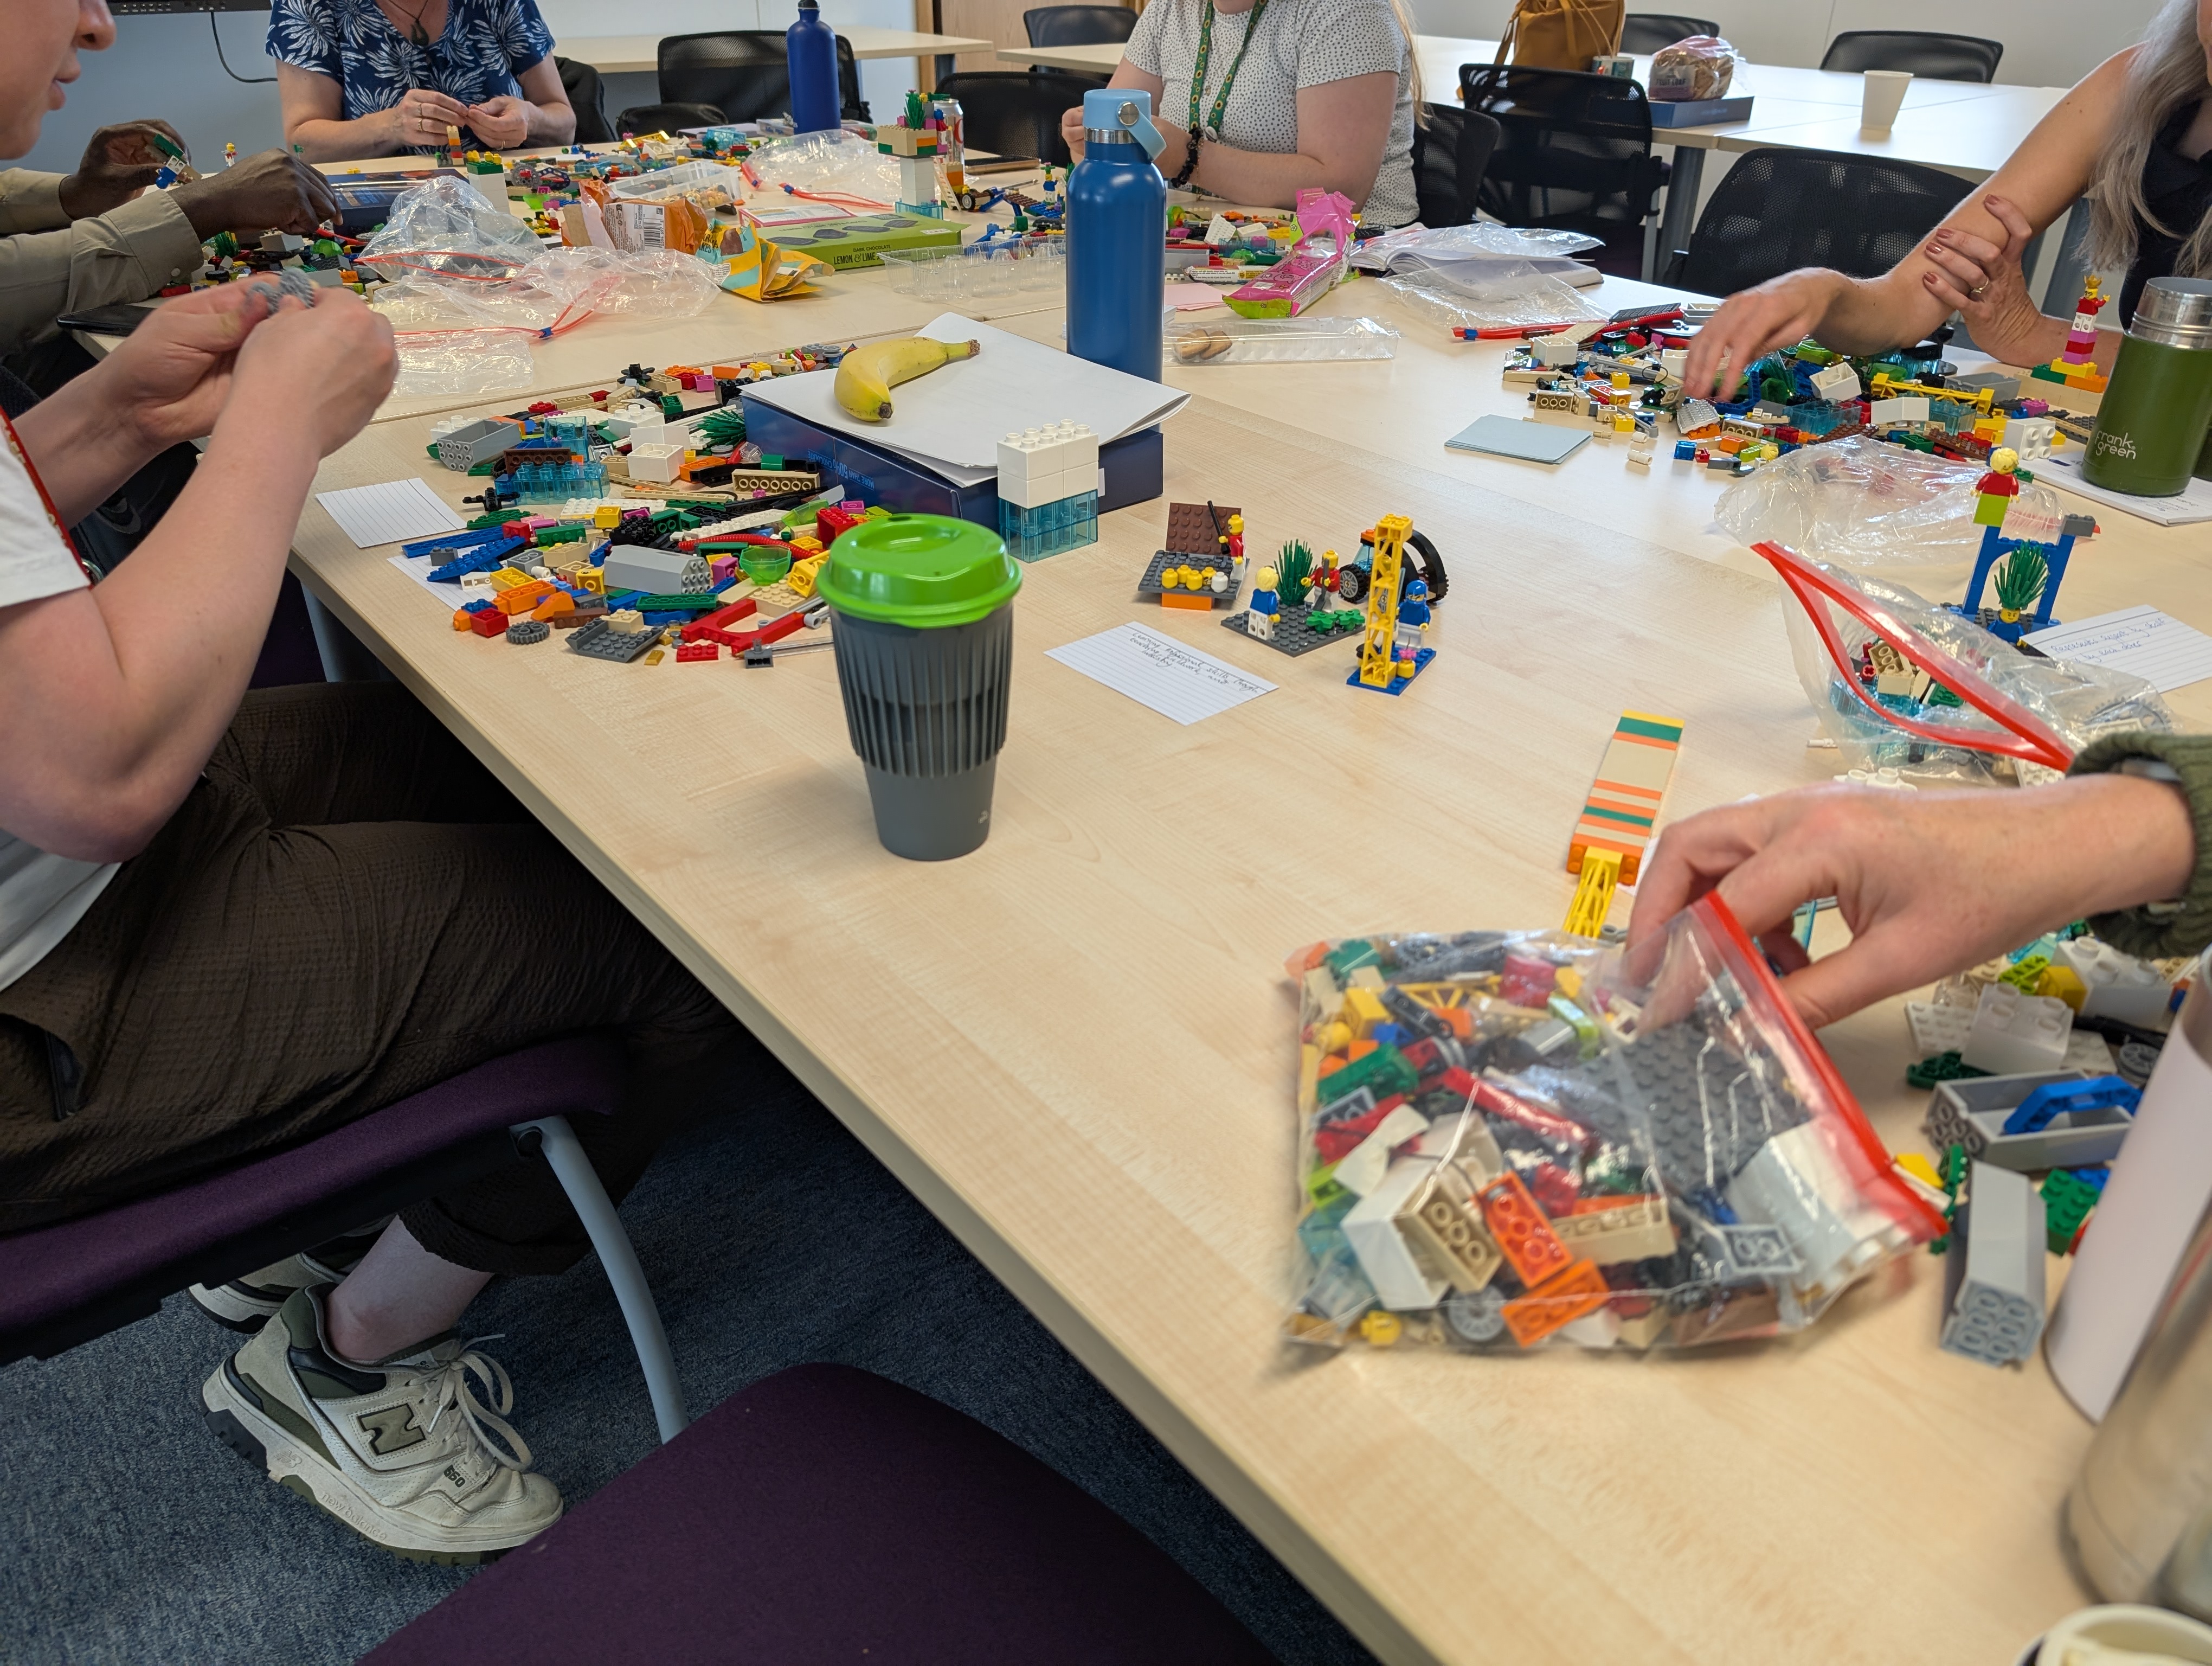

LEGO® SERIOUS PLAY®

In the last month I had the great pleasure of the supporting the Geography staff at York St John University with a LEGO SERIOUS PLAY inspired workshop. I was asked to support the department as they considered the best ways to support the future employability of their students and the creative approach of the workshop led to some valuable insights.

A table filled with Lego and models and surrounded by people
Making models with York St John’s Geography staff.

I’m looking forward to October this year where I will be returning to Southampton to once again deliver a Play you PhD workshop to the new cohort of Flood CDT students.


Project Prospero

Project Prospero is my hobby project where I am combining two pillars of geekdom into one nerdy-monster – a Warhammer-themed train set! The setting is the homeworld of the Thousand Sons Space Marine Legion, Prospero, as it is being pillaged by the Space Wolves Space Marine Legion. I am using models from the Legions Imperialis game and n-gauge tracks and trains. The centrepiece will be the giant pyramid of the Pyrae Cult, partially destroyed, using a Playmobil pyramid as its base.

This month I have been progressing the models and mocking up the layout to get some idea of scale. Because I don’t have space to leave out a layout, it will need to be fully modular. Check out a video I made from my mock up below:


About this Newsletter

I am Chris Skinner, a science communicator, STEM professional, and ADHDer. I am on a mission empowering people to unlock their full potential by transforming imagination into a powerful, actionable skill. This newsletter tracks my journey. I would like you to join me, so please subscribe. This newsletter is free and I do not offer a paid tier. If you would like to say thank you and/or help me in my mission please buy me a coffee using the link below.

Buy Chris a Coffee

Support FloodSkinner. Ko-fi.com/floodskinner
Click to support me.

Views expressed in this newsletter are mine and do not represent those of my employer. Content and links are provided for informational purposes and do not constitute endorsements. I am not responsible for the content of external sites, which may have changed since this newsletter was produced.

All my links

The human factor in flood warnings: a failure of imagination.

The Human Factor in Flood Warnings: A Failure of Imagination

In July 2021 devastating flood impacted northern Europe, including Belgium, Germany, and the Netherlands. The floods caused over 10 billion Euros worth of damage and caused extensive damage to properties and communities over large areas. Tragically, nearly 200 people lost their lives.

This is despite the flooding being well forecast by the European Flood Awareness System (EFAS), which provided warnings 3 to 4 days in advance, seemingly giving organisations and individuals enough time to prepare. Even if they could keep their homes and businesses safe, they should have had time to keep themselves safe.

Professor Hannah Cloke of the University of Reading, who specialises in flooding, wrote an article for The Conversation following the flooding examining the reasons for why warnings were not as effective as expected. Hannah was involved in setting up EFAS, so was well positioned to comment and I think you might expect her to pass the buck, to say the science was right and it was not the fault of the forecasters that those warnings were not heeded. But she doesn’t.

Quote by Paul Virilio: When you invent the ship, you also invent the shipwreck; when you invent the plane you also invent the plane crash; and when you invent electricity, you invent electrocution... Every technology carriers its own negativity, which is invented at the same time as technical progress.

The philosopher Paul Virilio wrote about technology: “When you invent the ship, you also invent the shipwreck…“. As scientists, when we create anything we need to imagine what could go wrong and own that. It is not enough to put together an early warning system, however world leading, accurate, and timely, if no one acts on it.

Six mountains right to left, joined by bridges. Each is labelled, from left to right, Observation (sensor technology), weather forecast (atmospheric modelling), hazard forecast (environmental modelling), impact forecast (socio-economic modelling), warning (communication science), decision (behavioural psychology).

Golding et al (2019) described how early warning systems are made up of steps together in a chain. At each step, value is built as a mountain, between each step the value is lost in the ‘valleys of death’. Bridges of communication, understanding, and knowledge transfer ensure that value is retained and passed forward. The only value of an early warning system emerges when people respond to it appropriately.

Hannah described in her article how the failure laid in the way that warnings were produced, disseminated, and interpreted. The EFAS relies on public agencies to respond to their warnings – as happened in some places but not others – they are not available to the public. Professor Linda Speight, University of Oxford, who also specialises in flooding, described the difficulty of issuing warnings with the right message, especially when working with numerous different groups and organisations – a one-size fits all approach does not work for effective warning.

Both Hannah and Linda conclude that flood warnings are only effective if people understand the potential impacts on them. Linda described the benefits on impact-based forecasting, for example: “river levels will rise rapidly causing widespread flooding. Damage to roads and property is expected”. Hannah summarised the job of a flood warning (and science more widely) as “helping people see the invisible” – it is helping people imagine those potential impacts in response to the warning so they are compelled to take action. To Hannah, this failure in imagination was the missing bridge in the early warning chain, between warning and decision, where that value, tragically and literally, fell into the valley of death.

How would you help people see the invisible?

This post originally appeared in the Imagination Engines newsletter. To read this content a few weeks earlier, subscribe to the newsletter below.

Improving environmental models - less is more

Improving Environmental Models: Less is More

I am speaking to the environmental modellers now. Imagine, you have been asked to make your model better, to improve its performance, and generally make it a more useful tool for decision makers. You have got a generous budget and free reign to do whatever you want. Just take a short moment to think about what you would do.

When you read the paragraph above, what did you think about? I am going to guess it was something along the lines of “Amazing, I’m going to add in representation of that process the model currently doesn’t have”. Maybe it was how you would increase the resolution of the model or how you would collect more data to add into it.  I am also going to guess that you did not think about what you would take away from your model.

A recent study by Adams et al (2021), published in Nature, found that we are hard wired to solve solutions by adding things in rather than looking at taking things away, despite the fact that taking something away would have been the better and more efficient way. I really encourage you to watch the video below that nicely summarises this work.

I know when I have approached modelling problems, my go to has been to add something in, rather than to consider what could be taken away. Yet, often when we add in new processes or increase the resolutions we may improve our outputs but we also increase the complexity, resulting in slower processing speeds and increased uncertainties. When assessing the models on how useful they are to decision makers, we may have actually made them worse.

The European Centre for Medium Weather Forecasts (ECMWF) have recently upgraded their Integrated Forecast System. One of the improvements they made is a great example of taking something away to solve a problem. Previously, they had stored numbers using 64-bits of memory within their computers. Using 64-bit over 32-bit allows you to store bigger numbers, i.e., use more decimal places and increase the precision of the output. This sounds like it is better, it sounds like if you had the option to go to 128-bit you ought to as you could have even bigger numbers and even greater precision still. The flipside is that storing and computing with bigger numbers takes a tiny bit longer to do each time and when multiplied over the vast number of sums the supercomputers at ECMWF do, this adds up. They realised that they did not need that level of precision and, for many processes, using 32-bit instead of 64-bit made little different to the output. Making the switch reduced the computational load by 40%, meaning swifter, and therefore more useful, results.

Photo by Gabriela Palai on Pexels.com

This is not anything new in numerical modelling and reduced-complexity approaches are popular and long established. However, these were designed with a conscious effort to take things away and it is when we stop making this conscious effort that we default back to adding things in as a first option. This is especially true, as the video tells us, when our cognitive load is high. Next time you sit down to solve a modelling problem make sure to remind yourself to stop and think – what can I take away to make this better?

Chris

Fridays are my non-work day so I try to write a short blog post on my thoughts about environmental modelling, games, or really anything else that is on my mind. The purpose is for nothing more than the love of writing and for practice but I do hope you enjoy them. For the avoidance of any doubt, all of the views and opinions I express in these blogs are very much my own and not those of my employer.

The importance of useful models in research

The Importance of Useful Models in Research

One thing I’d really like to do in 2021 is get back into writing just for fun. Although I have written a lot academically in the last few years, my space and time to just write my thoughts had become really squeezed. I hope to use some spare time on Friday mornings to quickly put a few words together about what’s on my mind at the time and re-engage with the craft. These are my own personal views and opinions.

On the useful-ness of models

Most numerical modellers will be familiar with mathematician George Box’s quote “All models are wrong, but some are useful”. I love this quote, as even though I don’t think it was intended for numerical simulations, it strikes right at the heart of many of the issues our research community are trying to address.

Photo by Genaro Servu00edn on Pexels.com

Too often though, we don’t consider how ‘useful’ our models are. How wrong they are? Yes, we look at that all the time. We develop new ways to calculate, express, and communicate how wrong they are. We work hard on new methods and at collecting new, more, and better data so we can make the models less wrong. When we’ve done this, we have models that are either less wrong, which is good as they will be right more often, or are able to show us how wrong they might be, which is also good as it allows people to make better informed choices about risks.

When we do consider how useful a model is, it’s often in the ways discussed above. Providing decision makers with the information about how wrong a model is lets them make a better informed decision. It is more useful to them. Great, box ticked. But, in my opinion, the model does not stop there.

Photo by ThisIsEngineering on Pexels.com

In a recent post for CIWEM, Phiala Mehring, a floodie, research director, and PhD researcher, discussed how we communicate with communities affected, or at risk of being affected, by flooding. It’s a really important post so please go read it here. There was one paragraph that really stood out for me:

“Imagine having lived in your home for three decades, to have a complete stranger knock on your door to say you are at risk of flooding “because the flood model says so”. What do you believe; a model that simulates the area – or your lived experience of more than 30 years?”

In this situation, to this audience, it does not matter how precise and accurate that model had been made. All the effort and hours put in developing methods to communicate how wrong the model might be do not matter either. It also does not matter how useful decision makers found it. Here, in this situation, the model is useless.

How we utilise model results when working out in the real-world communicating flood risk is a crucial facet of the model’s development and its use. It’s just as important as finding reliable and accurate rainfall information to input into it right at the start of the chain. And it’s the reason we should always measure our models by that one criteria George Box proposed to us – how useful they are.

Below sea level does not mean below the sea

Below Sea Level does not mean Below the Sea.

This post represents my own views and is not intended to represent the views of my employer, present or past.

I’ve been umm-ing and ah-ing for a couple of months now about whether to write this blog, but I think I have finally had enough. You see, in Hull, we are at risk of flooding from the sea, or more specifically, the Humber Estuary. This risk emerges when low pressure out in the North Sea, caused by the storms, which can be common in the winter, effectively suck up the sea causing it to raise a little. High winds whip up waves, and these add a little more height to the water. All of this has the potential to raise the level of the sea, for a few hours, by up to a couple of metres. On December 5th 2013, a storm surge (as these events are called) raised the water level in the Humber by 1.7 metres.

The added complexity to this are the tides. The difference in the water level between low and high tide at Hull, according to the Associated British Ports (ABP) is between 3.5 m for a neap tide, and 6.9 m for a spring tide – this staggers the level we have determined to be 0 m, or sea level. This means the risk of flooding is all a matter of timing. If, on December 5th 2013, the storm passed by a few hours earlier or later the surge would have aligned with the low tide, and the additional 1.7 m would have barely been noticed by anyone. However, it was timed with a high spring tide, resulting in record water levels in the Humber and caused flooding in Hull and around the Estuary.

Coastal flooding

Graphic showing how coastal, or tidal, flooding forms. This was the type of flooding which occurred around the Humber in 2013. Thanks to NERC for producing these great resources. 

When we design and build flood defences on the coast we don’t build them to just hold back tidal levels of the water, but also to defend against enhanced water levels produced by storm surges. Since 2013, the defences around Hull have been updated and a repeat of the event would result in little or no flooding in the city – I don’t know the exact level of the defence, but we can say that it is able to contain sea levels of at least 1.7 m higher than the highest natural tidal level.

A big issue facing Hull is sea level rise. Sea level has been rising since the end of last ice age, and is set to continue in the future. On top of this, the climate change caused by our industry is accelerating this. Our best estimates for the Humber area, assuming that as a species we continue increasing our influence on the climate, suggest the sea level will be around 1 m higher in 100 years than they are today – this will increase the risk of flooding and we need to ensure that the public understand this and that we continue to invest in improving the standards of our defences to keep pace.

On the first point, talking to residents of Hull about the risk of flooding from the Estuary provokes two responses. (1) There is a lack of appreciation of the risk from the Estuary, and when I start to talk about the 2013 flooding, people tend to share with me their experiences of the 2007 flooding (a surface flooding event). (2) People tend to feel that there is no point in doing anything as “Hull will be underwater in 100 years”. This latter point is what I want to discuss here, it’s a common perception and leads to a kind of apathy where people become disengaged with flood risk and actions to mitigate for it, but it is wrong.

It is a deeply held belief that goes beyond even the city – in 2015, Dr Hugh Ellis, the now Head of the Town and Country Planning Association (TCPA), made the claim that the city would be underwater in 100 years –

“We need to think about moving populations and we need to make new communities. We need to be thinking, does Hull have a future?” (Source – Daily Telegraph)

Ok, he was trying to make a valid point, one that sea level rise is going to increase the risk of flooding for coastal cities, but I don’t think bold, and inaccurate statements, like this are helpful, and they only result in residents of the areas becoming disengaged – why do anything about the problem if it is futile?

But where does this idea come from? Why are people convinced Hull will be underwater in 100 years? Why do people think it will become the “Venice of the North”? Well, look at the map below –

surging seas

Screenshot from Climate Central’s Surging Seas Risk Zone Map – this shows the Humber Region, UK, with a 1 m sea level applied.

This is map of ‘risk’ taken for the Humber area. For areas outside of the US, the Risk Map has been produced using a map of land heights obtained from space by the Shuttle Radar Topography Mission, which mapped the entire globe at resolutions between 30 m and 90 m. The areas shaded in blue are all those ‘below sea level’ – normally 0 m, but in the map above I’ve set it at 1 m to represent the predicted sea level in 100 years time. Hull isn’t labelled on that map, but it basically the large blue area between North Ferriby and Hedon – very clearly ‘under water’.

But the method is problematic, it’s too simple. An average measurement of land heights over a 30 m area is fantastic when considering it is for the whole planet, however for determining flood risk it’s a bit rubbish. It smooths the land surface, removing obstacles, like wall, roads and buildings, and crucially, flood defences. The method also ignores ‘hydraulic connectivity’*, basically meaning that for water to flood an area it has to have a source of water and a route for it to get there – flood defences work by removing this hydraulic connectivity and this is why today the Humber region, and much of Holland, is close to or below sea level, but not under the sea.

To understand the actually risk posed by sea level rise requires a more complex model, one which accounts for tides, contains more detailed data, and more importantly includes flood defences. Our model (paper here behind paywall) does this, and a version of it is incorporated into Humber in a Box – with both of these we observe no flooding around the Estuary for natural tides with a 1 m sea level rise. This is because the defences are built to hold back the much higher water levels caused by storm surges.

Climate Central have been careful to refer to this shading as ‘risk’, and not direct inundation by the sea, but the use of blue and not making this explicit anywhere opens this up to mis-interpretation where ‘below sea level’ means ‘below the sea’. This is clearly happening – see this article in the Conversation, which made the BBC Sports pages, which used the app to suggest Everton’s new stadium “could end up underwater” in the future, or this article shared by the awesome Geomorphology Rules  Facebook page, suggesting that coastal cities in the US will be “drowning in water”.

Sea level rise is going to increase the risk of flooding in coastal cities but they are not going to be under water. The risk does not emerge from the tidal water levels, which will most likely be contained by present defences, or those to be built in the future. However, the risk from storm surges will increase – the likelihood of events like December 5th 2013 is set it increase, both in strength and frequency, and with 1 m extra sea level in 100 years our defences will need to be updated to cope with the enhanced levels. This will take a lot of money, a lot of effort, a lot of political will, and this requires the buy in and support of the residents of these areas. Telling them, or suggesting, that they will be required to relocate will only achieve the opposite.

Sea level rise and the related flood risk is a complex issue and we can’t keep trying to find simple answers.

*For areas within the US, the method uses much higher resolution height data, and accounts for hydraulic connectivity by shading areas differently.